Real-Time Monitoring& Reports
Live dashboards, complete call detail records, analytics charts, and WebSocket-powered extension presence. Know what's happening across your entire phone system — right now.
The numbers behind the numbers
Answer rate, talk time, busiest hour and the inbound-outbound split — for today or the week.


Numbers that answer a question
Most call reporting tells you how many calls you had, which nobody acts on. The useful questions are narrower: when are we missing them, who is carrying the load, and how long does this actually take.
When you are missing calls
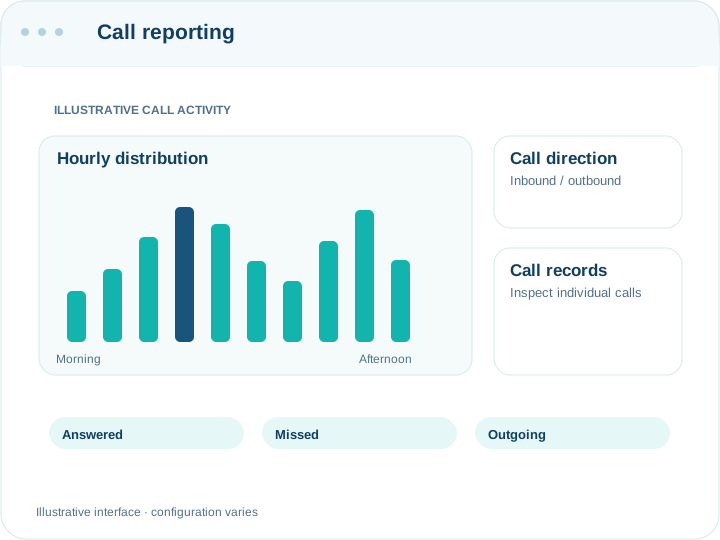
Hourly distribution shows answered against missed across the day, so the gap shows up as a shape rather than a percentage. A missed-call rate of twelve per cent is unhelpful; twelve per cent concentrated between one and two in the afternoon is a lunch rota problem with an obvious fix.
Direction, because inbound and outbound are different businesses
Inbound, outbound and internal are counted separately for today and for the week. A support desk and a sales floor have opposite profiles, and a single total hides which one you are looking at.
Talk time, answer rate and the busiest hour
Average duration is calculated over answered calls only — averaging in the zero-length missed ones produces a number that means nothing. Alongside it: answer rate, total talk time, the busiest hour, and the week's running total.
Every call is still there underneath
The summaries sit on top of a call log you can filter by direction, status, number and date, and export to CSV or PDF. When a customer says nobody called them back, the row with the timestamp and the hangup cause settles it.
The live view is a different question
Reports answer what happened; the contact-centre view answers what is happening. Active channels, who is on a call and which queues have people waiting are shown as they change, which is the screen a supervisor keeps open during a busy hour. The two are deliberately separate — a dashboard that refreshes every second is the wrong place to read a week's trend.
Getting the numbers into your own tools
Everything on these pages comes from the API, so nothing here is a dead end. Pull the call log on a schedule into a spreadsheet or a warehouse, or subscribe to webhooks and receive call events as they complete. The reports are a convenience, not the only way out.
6 Analytics Capabilities
Deep visibility into every call, agent, and queue across your system.
Contact Center Dashboard
Live agent status overview with queue depths, active calls, and waiting callers. Auto-refreshes every 15 seconds so supervisors always see the real-time picture.
Call Detail Records
Complete CDR for every call — source, destination, duration, status, recording link, and cost. Fully filterable and searchable with date-range, extension, and direction filters.
Analytics Charts
Visual breakdowns by hour, day of week, direction (inbound/outbound), and call status (answered, missed, busy). Identify peak hours and staffing gaps at a glance.
CSV & PDF Export
Export raw CDR data as CSV for spreadsheet analysis or generate formatted PDF reports for stakeholders. Schedule automated report delivery via email.
Extension Presence
Real-time WebSocket-powered presence: see which extensions are Available, Busy, Ringing, or Offline. Instant updates without polling for true live monitoring.
Recording Playback
Stream call recordings directly in the browser with full audio controls — play, pause, seek, speed adjustment, and download. No third-party player required.
Technical Specifications
What is measured, and what is not
Is the data live?
Call records are written as calls end, so the day's figures update through the day. The live dashboard shows active channels in real time.
Can I see per-agent performance?
Calls carry the extension, so you can filter by person and see their volume and talk time. There is no scoring or ranking built in — the raw calls are there and what you conclude from them is yours.
How far back does it go?
Call records are kept indefinitely. Recordings are the ones with a retention limit: seven, thirty or ninety days by plan.
Can I get the data out?
CSV and PDF export from the call log and the reports page, and the API for anything you want to pull on a schedule.
Does it show which campaigns produced calls?
Campaign results are reported separately, per campaign, with answered and failed counts and per-recipient outcomes. Linking a later inbound call back to a campaign is not automatic.
Can it alert me when the missed-call rate goes up?
Not natively — there is no alerting engine. The API and webhooks give you the events, so a threshold alert into your own chat or monitoring is straightforward to build, but you do build it.
Do the figures include internal calls?
They are counted and shown separately, so desk-to-desk chatter does not inflate your inbound numbers. The direction breakdown is where you see the split.
Ready to See Your Phone System Clearly?
Real-time dashboards, full CDR, analytics charts, and WebSocket presence. Know everything, miss nothing.